In 2018, I started using an app I really enjoy. I call it my automatic journaling app, which is called Life Cycle. Despite liking it quite a bit, I was always a little bit worried it was completely stealing and selling my data. The good news is that Apple came out with a description of how data is used, and it reports that there is no data linked to you and it only looks at diagnostic and usage data. That gives me a bit of comfort. We’ll talk about this app, the data it tracks, and why security is so important. But if you get wigged out about security, for example, maybe you’re going somewhere you don’t want other people to know, you can put a passcode on the app to ensure it is even more secure. The app was created by a company called Northcube, and they have a description of their security policy. It says, “You own your personal data, and you’re always in control.”
I said a while ago on this podcast that I use journaling apps, but I’ll tell you a deep, dark secret. It’s sometimes different from the day an event happened. Sometimes, I record my days a couple of days later, within that week or the month. So, remembering what I do in my life is always helpful. First of all, the app starts by tracking your location. It must run in background mode to even work, but I noticed it does not have a battery drain. I never saw it as any big part of my battery usage, despite the fact it is always running. And when you’re at a location, it will record how long you were at this place.
Connecting Location to Places and Activities
It will ask you about the friendly name for the location and what you were doing. This is the part where you indicate your answers. Maybe you were at a restaurant, the gym, or your favorite flower shop, and perhaps you were shopping, exercising, or eating out. Once you tell it these answers, it will always remember that location and start tagging those events when you go there again. The only action that you need to take is when you go to a brand-new location.
It can also detect whether you’re walking, probably by the speed, or driving to a location. So I could see how much time I was spending commuting every week. Guess what? By working from home, I saved myself 27 minutes a day. While working remotely in Los Angeles, I saved hours a day.
Location
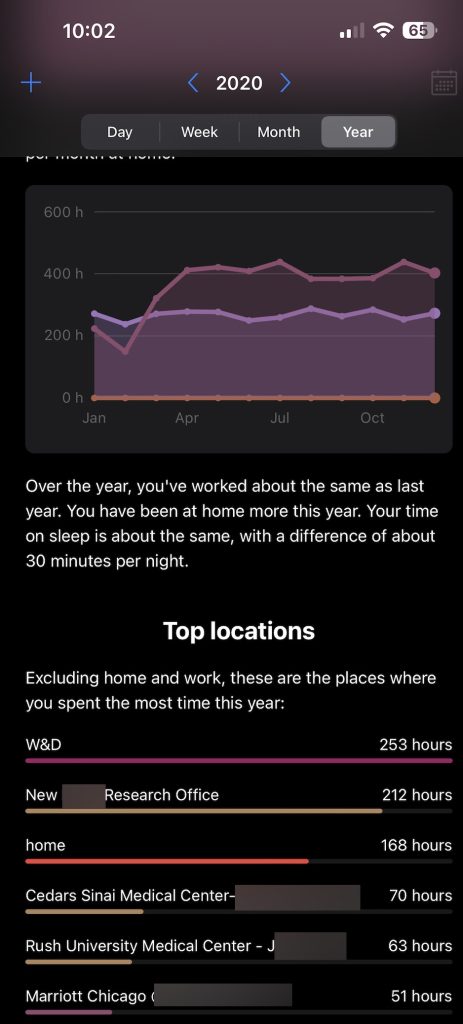
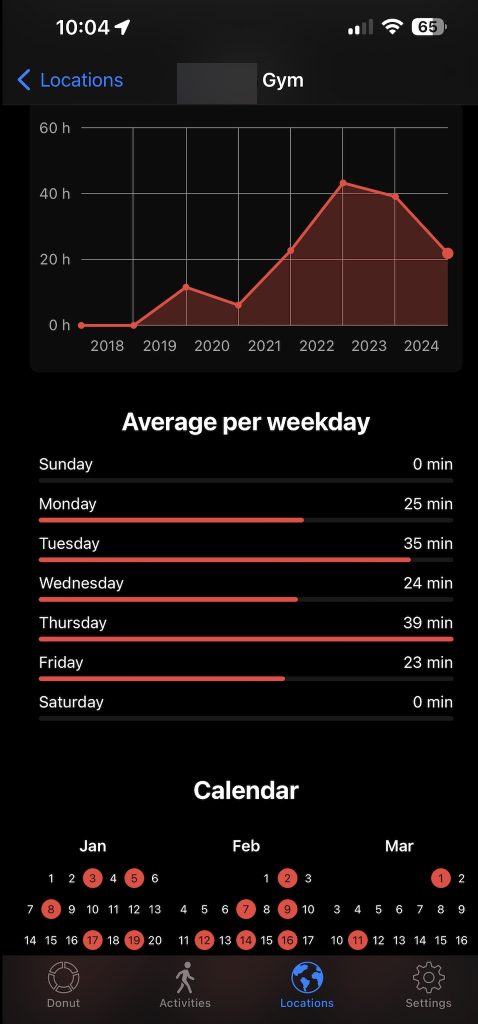
First of all, when you look at the location, you can see how many unique places you have been, and if I look at a location, I can see how often I go there and how much time I’ve spent in this particular location. I can look at an all-time chart over the years. I can see how often I go to each birdwatching location I visit regularly, and I can see a calendar of all the times in the last year I’ve been there. But at the bottom, I can see a total list of the times I’ve visited this place.
Activity
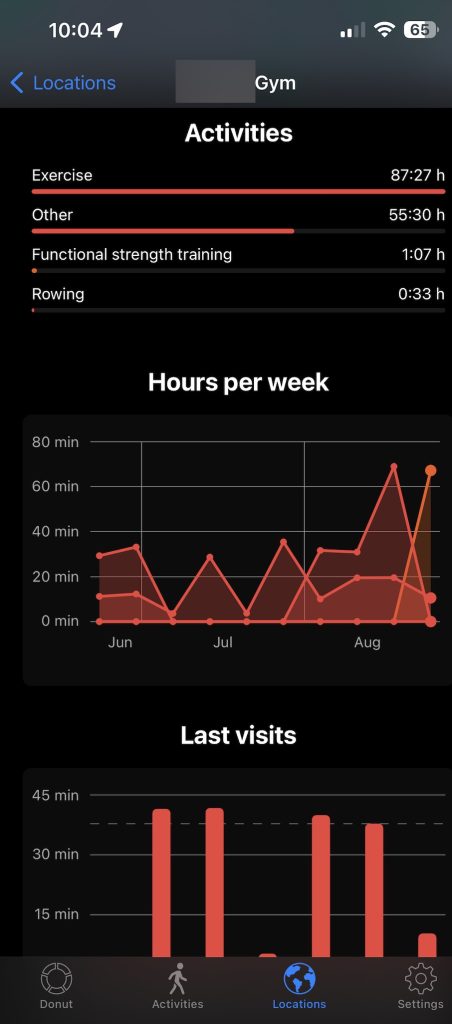
When it comes to activity, I can see a chart of how often I’ve done this activity, the last times, the last few times I’ve done this, an all-time chart, year by year, the top locations I do this activity, the averages per day of the week. Guess what? I go birdwatching on Saturdays more than I do on Tuesdays. That calendar view of the last year of how many times I’ve gone birdwatching, strangely enough, very populated in March, April, and May, but not so much in July and August. Did I mention it’s really warm outside?
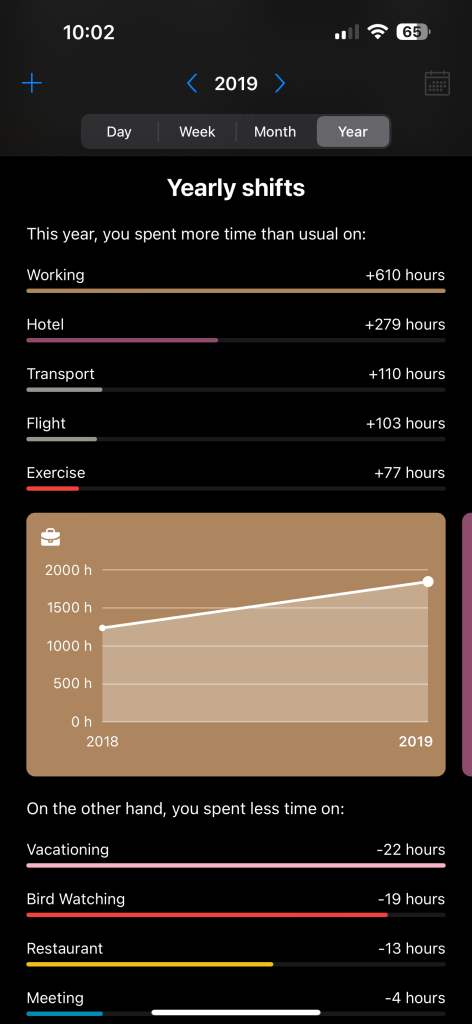
Then, I can see the top locations where I’ve done this activity and the total number of times I’ve been there. I’ve gone to my favorite marsh 259 times. That’s not surprising. But again, I can look at a day, and the day will show me what I did today. I can look at a week, month, and year basis and see the stats of how I’ve done this month and this year. Am I birdwatching quite a bit? Do I go hiking a lot? Am I sitting at home way too much? It will remind me of how often I do an event. I went to a restaurant last week, and it was suggested that I hadn’t eaten out in a long time. It is called a returning habit. But if you’re doing something all the time, it will call it a continuing habit. I go to the gym three times a week. Yay me.
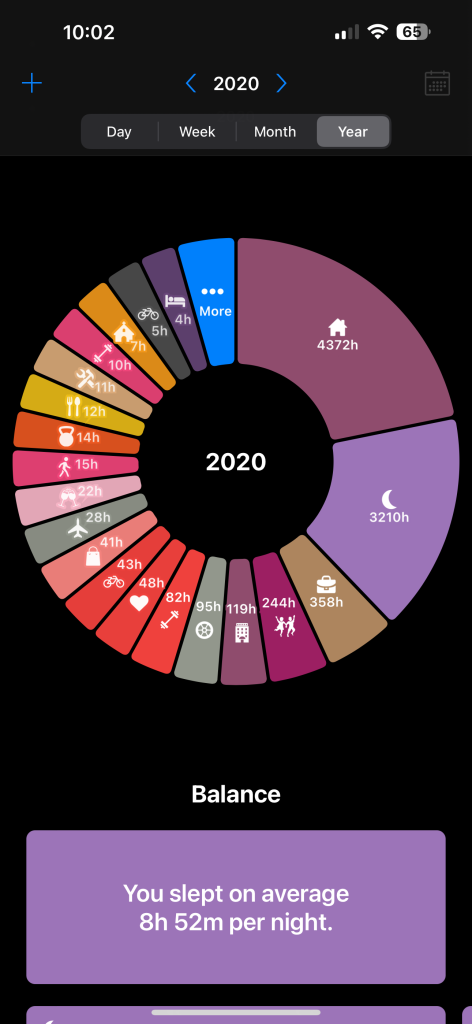
The Daily Donut
It creates a nice pie chart it calls your daily donut. But now I really wish I had a donut. But that pie chart shows me how I’m spending my time. How much time was sleeping? It takes that from the Health Kit. How much time was I walking? Driving? How much time did I spend at the doctor’s today? And how much time did I spend at the gym? If I’m looking at it weekly, monthly, or yearly, it will create line charts for me to see how much I’ve done recently. What are some habits I’m still doing, and what are some habits I’m doing again? At the very bottom of the page, it will show you any location it doesn’t know about and wants you to sign an activity to. So if I go to a brand new park, I can say this is Bob’s Park. What do I do there? I go bird watching. Now, I will never forget it. In the end, it’s a little detail, but it does give me the ability to remember what I do, what days I do it, and how often.
Other Features
I can share data if I wish to do so. There are some methods that I can share on Facebook, which I don’t do. It can also synchronize across all my devices, which makes it nice and handy. It does not have a webpage. It says that if I ever came to the point where I wanted them to delete all the data, I could email them, and they would delete it. It also asks me if I want to connect this journal to my photo library. While I’m out bird watching, I want to show what birds I saw. I saw a scarlet tanager the last time I went. I may want to add that to my journal and not just have it be a memory tracker. The app is free and on the iOS store, but its automatic backups are part of the premium account. This app is free and on the iOS store, and it does a great job of automatic journaling. As I said, it always runs in the background, and it can remind you of when you went to a certain location.
My friend and I went to a restaurant a few weeks ago, and we said, “When was the last time we were here? It’s been a while.” And it had been a while. Sometimes it’s just for fun, but sometimes it’s more informational. For example, do I usually go to that marsh in April? I can see that this year was the earliest I visited that marsh. I can connect it, like I said, to HealthKit, and it’ll bring in my sleeping. I can also export the data into a CSV. But when I get the premium account, it’ll automatically back up for me. So, in case something happens to my phone, it offers additional graphs and charts so I can see my trends over time.
Sleep Cycle
It allows me to connect to its other app, which they own called Sleep Cycle. Way back in the day, when I did my first review for Allison, I said that I thought sleep tracking was awesome, and that was the app I was using. I could create tags. I could label my sleep as being too hot, too cold, or, you know, whatever I wanted to create a tag for. This was really helpful to me. But now I can type the Sleep Cycle to my Life Cycle app.
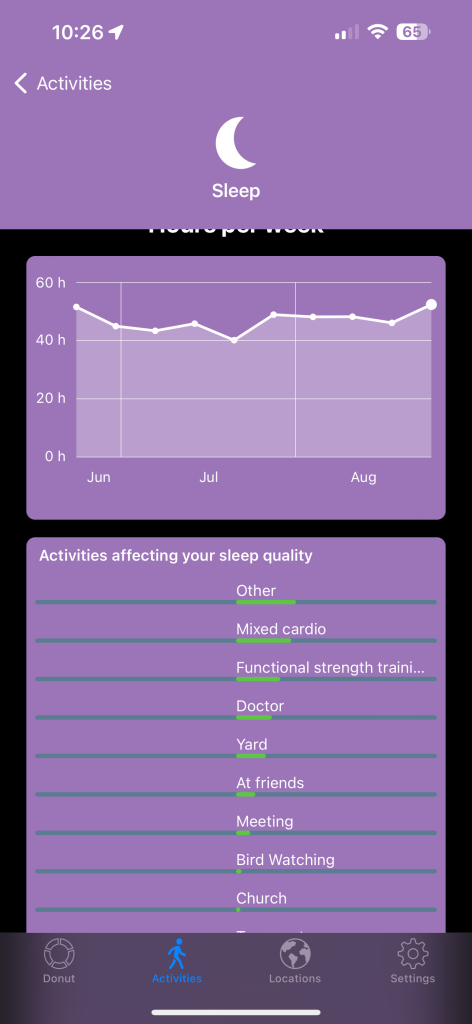
And I found some very interesting pieces of information. My worst night of sleep? Wednesday night. Why would that be? Do you know why? Because I go to my friend’s house on Tuesday night and stay there pretty much till bedtime. That means I’m probably getting too extroverted, winding up my energies too much, and then I go home and go right to bed and have trouble sleeping. But you know what? On the days I go bird watching, hiking, or get a lot of exercise, I sleep great; I’ve learned some stuff about myself by tying the Sleep Cycle to Life Cycle.
As we learn about our lives, we can start acting on the information and improving our lives. If you’re looking for an automatic diary, Life Cycle might be the one for you. Maybe you’ll finally remember what you did last Saturday or month or how often you surfed. If those are questions you ask yourself, this might be the right app for you.