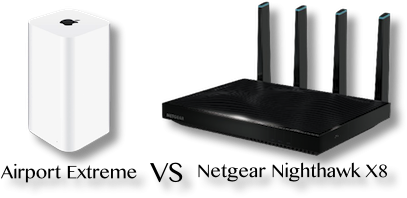
 Back in April I told you about the new router I bought, the Nighthawk X8 from Netgear. I bought this router for two reasons. I already had an Airport Extreme 802.11ac router with beam forming antennas, but after talking to Bart about how insecure the Internet of Things devices are, I wanted to run two parallel networks. The second reason is because it sounded really cool.
Just a few weeks ago, Denise Crown did a review of the same router for us. She’s a serious network nerd (Masters degree in Telecom) so I really liked hearing her perspective on it.
One thing neither of us did was any kind of network speed tests to see whether a) we needed this router and b) whether the new router improved speeds or reduced dead spots in our homes. We had both been influenced by Dave Hamilton of the Mac Geek Gab where he talks a lot about routers. I reached out to Dave and asked him what he uses to check network speeds. I knew that while running speedtest.net was a relatively good way to test your Internet speeds, it wasn’t a good way to test the speed of your internal network. Since the speed test was going through Internet and back, it had far too many variables involved.
Before we dig into the tests, let’s review the devices. The Airport Extreme is the current model, which has internal beam-forming antennas. It’s only a dual-band router, with one radio for 2.4 GHz and another for 5 GHz. The Nighthawk X8 is a tri-band router with two 5 GHz radios and one for 2.4 GHz. By having two 5 GHz radios the Nighthawk can send and receive at the same time. It also sports four internal antennas and four active external antennas. That all sounds swell, but at 1.7x as much money for the Nighthawk X8 over the Airport Extreme, let’s see how they perform relative to each other in real world testing.
Bandwidth Testing Tool
Dave recommended a command-line tool called iperf that tests point-to-point inside your network. He pointed me at two great articles on The Mac Observer by Jim Tanous. The articles tell you how to first install Homebrew, the open source package management system, and from there how to install iperf. This sounds super intimidating but it’s a matter of copying and pasting just a couple of commands into your Terminal and you’re in business.
Of course you should always copy terminal commands to a plain text editor and then paste into Terminal. I forgot to do that but you should be smarter than me. We know TMO is a site above reproach but you never know when someone’s been hacked.
You install iperf on one computer that you hard wire to the Ethernet port of your router, and that computer becomes the iperf server. Make sure you turn off WiFi so you’re sure it’s on Ethernet. You install iperf on a second wireless computer that you will use to wander about the house, and it will serve as the client.
Now you note the IP address of the server.
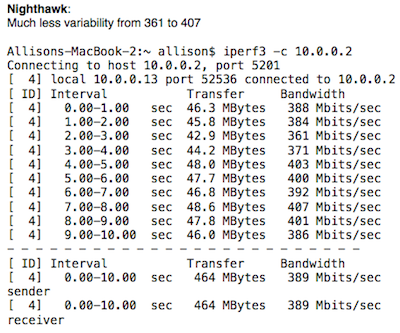
Once both computers are on the same network (the server on Ethernet and the client on wireless), you run the simple command iperf -s on the server, and on the client you run the command iperf -c ip_address_of_server. As soon as you enter that command on the client side, iperf runs ten consecutive tests of the network, in one second intervals. iperf displays the bandwidth speed for each test and the average of the 10 tests in Mbps.
Bandwidth Testing Process
Early on in my testing I fantasized about comparing the 2.4 GHz speeds along with the 5 GHz but it was too much data so I simplified to just the 5 GHz network of both the Nighthawk X8 and the Airport Extreme.
I created a Google Doc spreadsheet to collect the data. This will turn out to be an important bit of my testing process. When I started on this adventure I figured I’d just wander around the house, test one network, go back to the server, switch to the other router and do it again. Unfortunately I noticed right away that there was a fair amount of variability the results of my testing. Steve is an electrical engineer who worked in antenna design and signal processing, so I pinged him (see what I did there?) for advice. He explained that the 5 GHz band is much more susceptible to things like its location, the rotation of the laptop itself and even how I was located with respect to it.
The only way to do reduce these variables was to have the laptop be stationary and me sit as still as possible in one location, test one network, and then test the other network. Well to do that, I couldn’t very well be dashing back and forth and moving my arms around to type the results. Steve became my able assistant to sit at the iperf server and swap out the Ethernet cable to switch routers.
Having a Google Doc meant that either one of us could type the results, and if he was typing I could watch the Google Doc real time. I should mention that both the server and the client show the results in the Terminal window so we could both see what was going on.
We ran a few tests and we still saw variability so we decided that I would run each test 5 times, allowing us to average 50 results for each location and for each router. We tested 10 locations, so that’s 1000 tests run on the two routers. I’d say that should be enough to get some clean data!
Observations
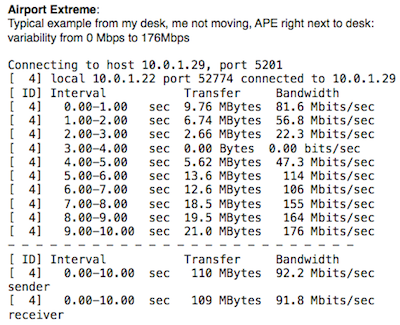
Before I give you the answer (you’ve all moved to the bottom line anyway, so it’s good to tease you along), I want to make one observation. The Airport Extreme, even on 5 GHz, showed a lot more variability even within a run of 10 tests by iperf. In one test, with the client about 4 feet from the Airport Extreme, the speeds went from a high of 176 Mbps to a low of 0. It was not uncommon to see variability of 100% or more.


Results
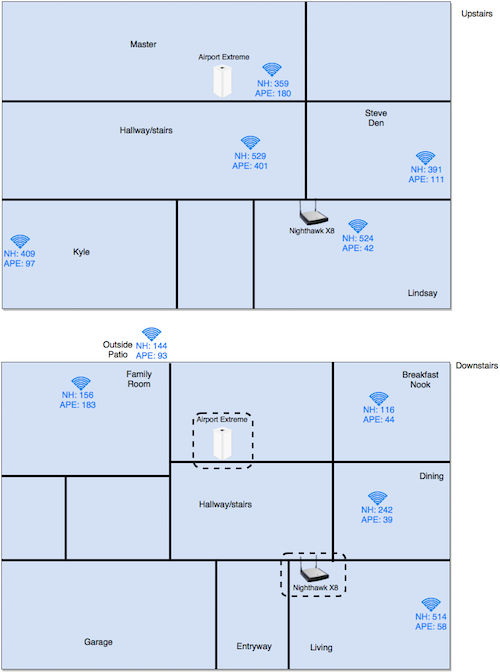
I thought it might be useful if you could see the results of our testing overlaid on a simplified diagram of our house. It was clear from our results that proximity to the router mattered a lot (we could have guessed that). I drew the layout of our house using Draw.io. It’s pretty crude but it reasonably represents the location of the routers, the walls, and where in each room I was when I took the measurements.
In each location where I took a measurement, I’ve shown the speed in Mbps with a little WiFi symbol above them. NH is the Netgear Nighthawk X8, and APE is the Airport Extreme. While the two routers are physically located upstairs as shown, for reference I’ve also shown their location on the lower floor with a dotted line around each so you can ponder what affect the router’s location might have had on the measurements through the floor AND the walls.
The Nighthawk X8 beat the Airport Extreme in 9 out of 10 locations. In the one location where the Airport Extreme was faster, the Nighthawk X8 was 86% of its speed.
However, in the other locations, the Nighthawk X8 beat the Airport Extreme by anywhere from 1.3x as fast to 12.6x as fast. Oddly enough, the Nighthawk X8 was twice as fast as the Airport Extreme in the test I ran sitting right next to the Airport.
On average, of the 500 tests on each device, the Nighthawk X8 was 2.7x as fast as the Airport Extreme. The current Airport Extreme costs $200, while the Netgear Nighthawk X8 costs $350. So for 1.7x the cost, you get a router that’s 2.7x as fast!
I’ve created a viewable link to the Google Doc with all of the results: docs.google.com/…


Hello Allison,
What is the value for cell G2? I have a feeling that you have it wrong (right now it is an average, not an actual raw data).
Hai – H2 is the average. G2 is the 5th of the five Nighthawk X8 texts at that location. The heading says “NH Test 5”. H2 says “NH Average”. Make sense?
I know that columns C-G contains the measurements and column H is the average. However, cell G2 should have contain a measurement, but it contains average(C2-F2). That is not correct.
BTW, I took your data from the Google sheet and created this interactive viz (geek speak for visual): https://public.tableau.com/views/NighthawkX8vsAirportExtreme/NighthawkX8vsAirportExtreme?:embed=y&:display_count=yes
You can also do that on your own using Tableau Public. Disclosure: I work for Tableau and love the products.
You can click on the Share link below the chart and embed the viz into your website–very cool.
The link above was not working, this one does: http://tabsoft.co/2c6k3YU
Hai – this is SERIOUSLY cool!!! I’m going to do one myself. I would rearrange the rooms, there are a bunch of downstairs rooms on the right side showing the big gaps (not just upstairs). I can’t wait to play with this.
And my bad – I was looking at G3 not G2. We typed in real time while running the tests so I have no idea what should go in there. I guess I should empty the cell.
Good news Hai – I went back through the revision history in Google Sheets and it was ALWAYS 359, then I tried removing 359 and the average is STILL 359. So, it must have been 359. Good catch though!
Allison,
Of course this stuff is much cooler than Excel–That was what I thought when I started my job at Tableau. By the way, you can download Tableau Public for free, go to my viz, click download and start authoring. Note that I have to normalize your data by turning it into a form that Tableau can work with, you can see that data here: http://bit.ly/2bAPEjU
I am a screen reader user. “Are the internal web pages accessible for screen reader users?
Hi Rick – sorry it took so long to get back to you on this. My MacBook Pro was in the shop and my MacBook was having audio problems, which made it hard to test a screen reader! I’m not super good at VoiceOver on the Mac, but I was able to interact with elements on the router pages, dive down into screen areas, change values, toggle check boxes and use pulldowns. I think I found one element that wasn’t labeled well but everything else was. I didn’t do an exhaustive test, but it seems that the Netgear web-based software is accessible to screen readers.
Odd, i have both and my airport’s internet download speeds are double that of the nighthawk. Running googles speed test connecting to the night hawk results in 60-75mb per second downloads whereas with the airport extreme A1521 I am getting 100-120mb downloads.
David – using download speeds is really problematic because you don’t have a control group. Many things can affect download speeds while the testing methods described above is actually testing the real performance of the router itself, independent from the Internet itself, remote servers, number of hops the data has to take, shared network traffic if you’re on a cable modem, etc.